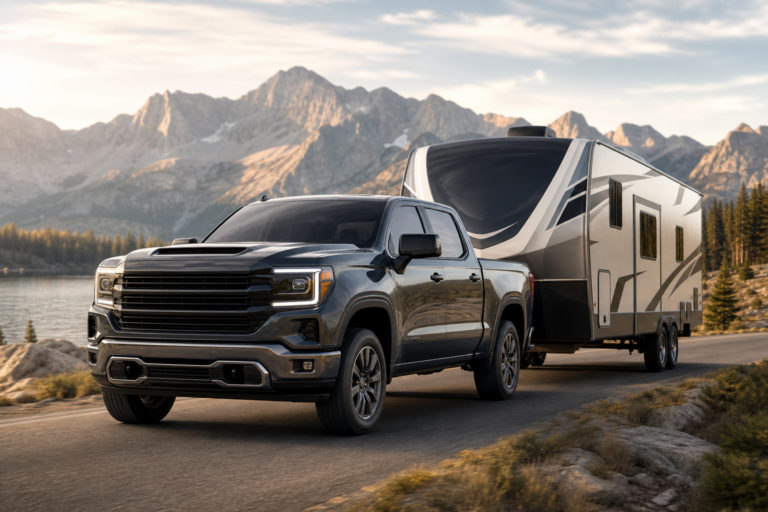
2025 Ram 1500 Hurricane MPG: Why Real-World Numbers Trail the Window Sticker
The 2025 Ram 1500 Hurricane and the MPG gap frustrating owners
If your window sticker says 24 MPG highway and you’re seeing 19 on a long trip, you’re not alone — and it’s not necessarily a defect. It is a real gap, though, and one that Ram should be more upfront about. The 3.0L Twin-Turbo Hurricane I6 behaves fundamentally differently from the 5.7L Hemi it replaced, and that difference shows up most in exactly the scenario many owners describe: sustained highway driving at real speeds.
What the EPA number on your sticker actually means
The 24 MPG highway figure for the 4WD Standard Output Hurricane comes from a controlled lab test, not a drive to Texas. The EPA’s highway cycle averages roughly 48 mph, with smooth acceleration, no headwinds, no hills, and no cargo weight. Vehicles are tested at a controlled temperature with the air conditioning off. The result is useful for comparing one truck to another — it is not a guarantee about what you’ll see on I-40 running 78 mph with the radio on.
The EPA does apply correction factors to try to bridge the lab-to-road gap, but even with those adjustments, real-world results consistently run lower. Consumer Reports and Edmunds have both documented that window sticker figures tend to overstate what drivers actually see, often by 10 to 20 percent depending on driving conditions.
Why turbocharged engines widen that gap
This is where the Hurricane’s design really matters compared to the old Hemi. A large naturally-aspirated V8 makes power through displacement. Its fuel consumption tracks throttle demand in a fairly linear way, and it doesn’t change behavior much between light cruising and moderate acceleration.
A twin-turbo I6 works differently. At light throttle and low speed, it can run lean and behave almost like a small economy engine — and that’s exactly what it does during the EPA test, where average speeds are low and acceleration is gentle. At real highway speeds, things shift. Green Car Reports found that trucks with turbocharged engines reported real-world fuel economy roughly 9 percent below EPA estimates, a worse gap than naturally-aspirated engines typically show. The reason is straightforward: when you need more power, the turbos spool up, boost pressure rises, and fuel consumption climbs with it.
In a full-size pickup moving 5,000-plus pounds through air at 75 mph, the turbos are working harder than the EPA test ever asked them to. That’s where the sticker number and reality start to separate.
Speed is the biggest single variable
Aerodynamic drag scales with the square of velocity. At 75 mph, a truck is fighting roughly 30 percent more wind resistance than at 65 mph. More drag means more throttle, more throttle means more turbo activity, and fuel consumption rises faster than you’d expect.
The EPA highway cycle averages 48 mph. If you’re running 75 to 80 mph across Pennsylvania and into Texas, you’re operating in a completely different aerodynamic environment than the test simulates. The 3 to 5 MPG gap that speed alone creates in a full-size pickup goes a long way toward explaining a 19 MPG real-world result.
Other variables that compound on a long drive
- Headwinds: Driving into a 20 mph headwind is aerodynamically equivalent to traveling about 20 mph faster. On an open Texas highway in the right conditions, this alone can cost 2 to 3 MPG.
- Elevation changes: Crossing the Appalachians burns extra fuel climbing. The descent doesn’t fully offset it — you’re usually off throttle on the way down rather than recapturing energy.
- Payload: Even a modest load in the bed adds rolling resistance and raises the truck’s profile into the wind.
- Fuel blend: Winter-blend gasoline contains more ethanol than summer blend and delivers slightly fewer miles per gallon. If a significant portion of those 12,000 miles ran from October through February, that’s a real factor.
- Tire pressure: Under-inflated tires increase rolling resistance measurably. Worth checking before drawing any firm conclusions about engine performance.
The trip computer might be lying to you
Multiple 2025 Ram owners have reported that the in-dash MPG display reads optimistic compared to hand-calculated figures. If the 19 MPG reading is coming from the dashboard, the actual number could be lower — or the display could be accurate and driving conditions simply explain the result. The only reliable method is to fill the tank completely, drive a meaningful distance, fill it again to the same level, and divide miles driven by gallons pumped. Run that calculation over two or three tanks to get a solid baseline.
Is the Hemi comparison a fair one?
The 2016 Ram 1500 with the 5.7L Hemi was EPA-rated for highway driving in the low 20s. Consistently hitting 23 MPG with that engine points to favorable conditions: moderate speeds, flat terrain, calm weather. Put both engines in identical real-world conditions and the Hurricane would likely match or edge out the Hemi — it’s a more efficient design on paper. The issue is that the two trucks aren’t being compared under the same circumstances. Different routes, different speeds, different weather, different years. The Hurricane isn’t worse; it’s just more sensitive to how you drive it.
When to actually escalate
If fill-up-to-fill-up hand calculations consistently show under 17 MPG on a highway-heavy tank — no towing, no mountains, speeds under 70 mph, normal weather — that’s a legitimate dealer conversation. Ask for a logged fuel economy test under documented conditions. Stellantis customer care can also check whether there are any outstanding calibration updates for your specific truck’s build date. Going in with three or four hand-calculated tanks of data is a much stronger position than a dashboard reading from a cross-country trip.
Sources
- fueleconomy.gov
- edmunds.com
- greencarreports.com
- carbuzz.com
- tfltruck.com
- media.stellantis.com
- pickuptrucktalk.com
- consumerreports.org
Related Articles